


Have you ever looked at your marketing reports and thought, “This tells me a lot, but none of it helps me understand if we’re actually getting good prospects”?
Most manufacturers are stuck there. But just like production, marketing only works when you’re measuring the right things. That’s why tracking meaningful KPIs is critical.
In this guide, we’ll break down the marketing KPIs that matter most for manufacturing companies.
Understanding Marketing Metrics in a Manufacturing Context
Marketing metrics in manufacturing exist for a very different reason than they do in faster, digital-first industries. Here, buying decisions are slow, technical, and tied closely to operations. A spike in leads or traffic rarely translates directly into revenue, and short-term performance often hides long-term risk.
In this context, metrics are a way to understand whether marketing is aligned with how the business actually sells, produces, and delivers.
The most useful metrics help teams see cause and effect: how demand behaves upstream, where it breaks down, and whether growth is strengthening the business or quietly straining it.
Before deciding what to track, it is important to be clear about what different measurements are meant to do.
Metrics vs KPIs vs Key Results in Manufacturing Marketing
Marketing Metrics for Manufacturing That Actually Hold Up in a Leadership Review
Manufacturing teams track a lot of numbers for a reason. In this industry, demand only becomes “good demand” when it can be produced profitably, delivered reliably, and repeated. That means marketing metrics (leads, CAC, ROI) only tell the truth when you read them alongside the manufacturing signals that shape customer experience, margins, and capacity.
This section gives you a practical way to do that.
Lead, Funnel, and Demand Quality Metrics
Early-stage marketing activity almost always looks healthier than it actually is. Website visits, form fills, and inquiries tend to spike long before there is any real indication of technical fit, budget readiness, or delivery feasibility. These metrics exist to prevent teams from mistaking interest for intent.
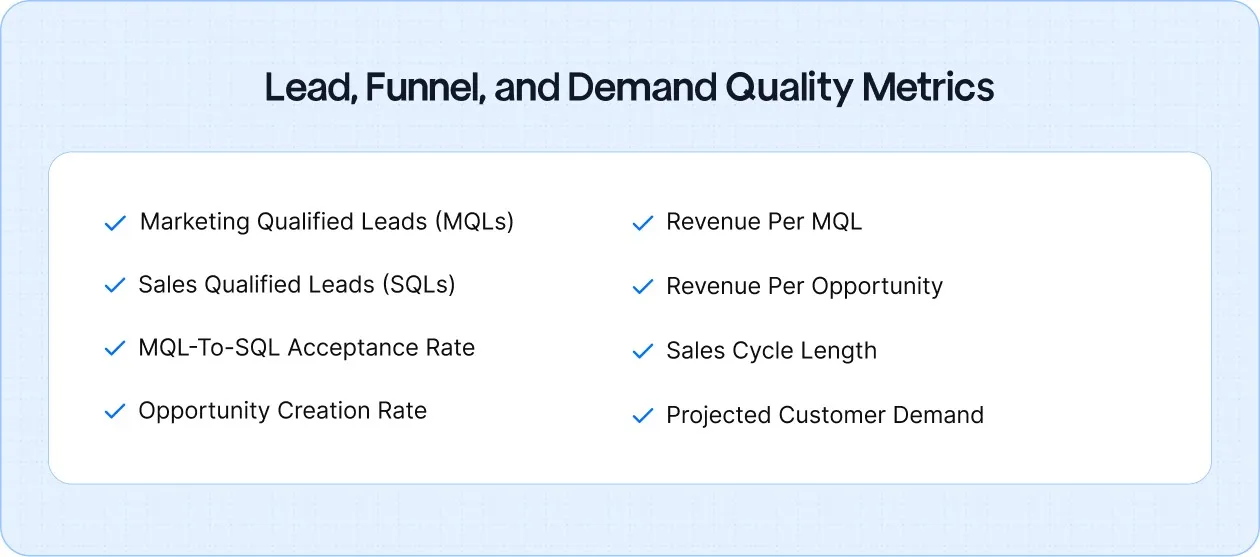
Lead and funnel metrics in manufacturing are about understanding whether marketing is sourcing demand that the business can realistically convert, deliver, and profit from:
- Marketing Qualified Leads (MQLs)
An MQL in manufacturing should reflect fit, not curiosity. Engagement alone is not enough. Industry, application, geography, expected order size, and basic feasibility matter more than clicks or downloads. When MQL numbers rise but downstream movement stalls, it usually means marketing is attracting attention without intent.
- Sales Qualified Leads (SQLs)
SQLs represent leads sales is willing to spend time on. Tracking them alongside MQLs shows whether marketing’s idea of “qualified” matches reality. A widening gap between MQLs and SQLs almost always points to targeting or positioning issues upstream.
- MQL-to-SQL Acceptance Rate
This metric reveals alignment across marketing and sales better than any dashboard summary.
Formula: MQL-to-SQL Acceptance Rate (%) = (SQLs ÷ MQLs) × 100
A declining rate typically signals ICP drift, overstated capabilities, or demand that operations cannot realistically support.
- Opportunity Creation Rate
This measures how many SQLs survive technical review, pricing discussions, and delivery checks to become real opportunities. Strong acceptance with weak opportunity creation suggests early qualification is still too shallow.
- Revenue per MQL
Manufacturing deals vary widely in size, making lead volume misleading.
Formula: Revenue per MQL = Total Revenue Attributed to MQLs ÷ Total MQLs
This metric shows whether marketing is sourcing meaningful work or low-value enquiries that drain sales time.
- Revenue per Opportunity
Tracking revenue at the opportunity level highlights which campaigns bring in strategic, repeatable projects versus one-off or low-margin jobs.
- Sales Cycle Length
Long cycles are normal in manufacturing, but increases over time deserve attention. Rising sales cycle length often reflects friction between promise and execution, such as unclear specifications or underestimated lead times.
- Projected Customer Demand
Demand forecasting helps marketing pace activity against real capacity. Generating demand that the business cannot fulfil may inflate short-term metrics, but it weakens trust and future conversion.
Production Efficiency and Capacity Metrics
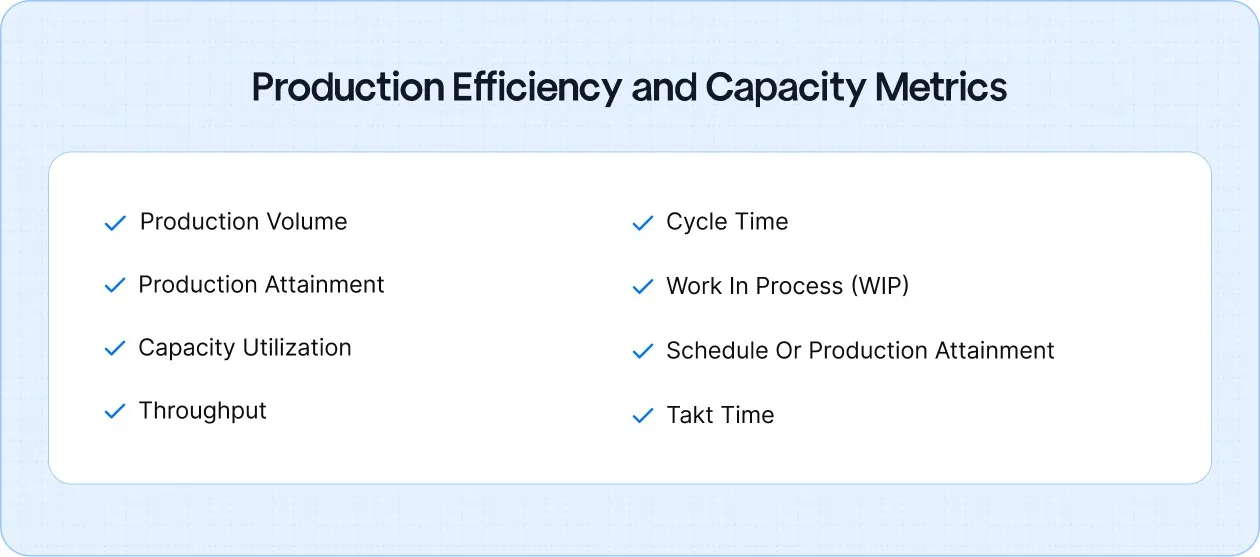
In manufacturing, marketing credibility is built long before a campaign launches. It is shaped by how consistently the factory performs when demand shows up. These metrics help marketing teams understand the real ceiling of growth, so promises made upstream do not collapse downstream.
- Production Volume
Production volume reflects how much output the business can deliver over a given period under normal conditions. From a marketing perspective, this metric defines the outer boundary of safe demand generation.
When marketing activity pushes demand beyond sustainable volume, the result is rarely faster growth. It is backlog, missed dates, and damaged trust. Stable volume trends give marketing room to scale. Volatile or constrained volume calls for restraint and prioritisation.
- Production Attainment
Production attainment measures how closely actual output matches planned output.
Formula: Production Attainment (%) = (Actual Output ÷ Planned Output) × 100
Consistently low attainment signals execution instability. In these conditions, aggressive campaigns amplify delivery risk rather than revenue. Marketing should treat poor attainment as a warning to slow demand or tighten targeting.
- Capacity Utilization
Capacity utilization shows how much of the factory’s theoretical output is being used.
Formula: Capacity Utilization (%) = (Actual Output ÷ Maximum Possible Output) × 100
High utilization suggests the business is operating near its limits, where marketing should focus on margin quality, pricing power, or selective demand. Low utilization, on the other hand, may indicate room for expansion-focused campaigns.
- Throughput
Throughput measures how many units move through production in a given timeframe. Unlike volume, it highlights flow rather than totals. For marketing, throughput constrains lead-time promises. Campaigns that promote speed or responsiveness must reflect actual throughput, not theoretical capacity.
- Cycle Time
Cycle time tracks how long it takes to convert raw inputs into finished output. Rising cycle times weaken claims around responsiveness and flexibility. When cycle time increases, marketing messaging should shift away from speed and toward reliability, planning, or quality to stay credible.
- Work in Process (WIP)
WIP represents inventory currently tied up in production. Elevated WIP often indicates bottlenecks, scheduling issues, or uneven demand.
From a marketing standpoint, high WIP is a signal to avoid promoting quick turnarounds or custom flexibility, as execution risk is already elevated.
- Schedule or Production Attainment
This metric measures how closely production adheres to planned schedules. Deviations increase risk when marketing commitments are time-sensitive, such as seasonal demand or customer deadlines. Strong schedule adherence gives marketing confidence to make firm delivery claims.
- Takt Time
Takt time represents the pace at which production must operate to meet customer demand.
Formula: Takt Time = Available Production Time ÷ Customer Demand
Understanding takt time helps marketing align demand generation with operational rhythm. When marketing pushes demand faster than takt time allows, stress accumulates across the system.
Equipment and Operations Effectiveness Metrics
Reliability is one of the hardest things for marketing to claim and one of the easiest things for customers to verify.
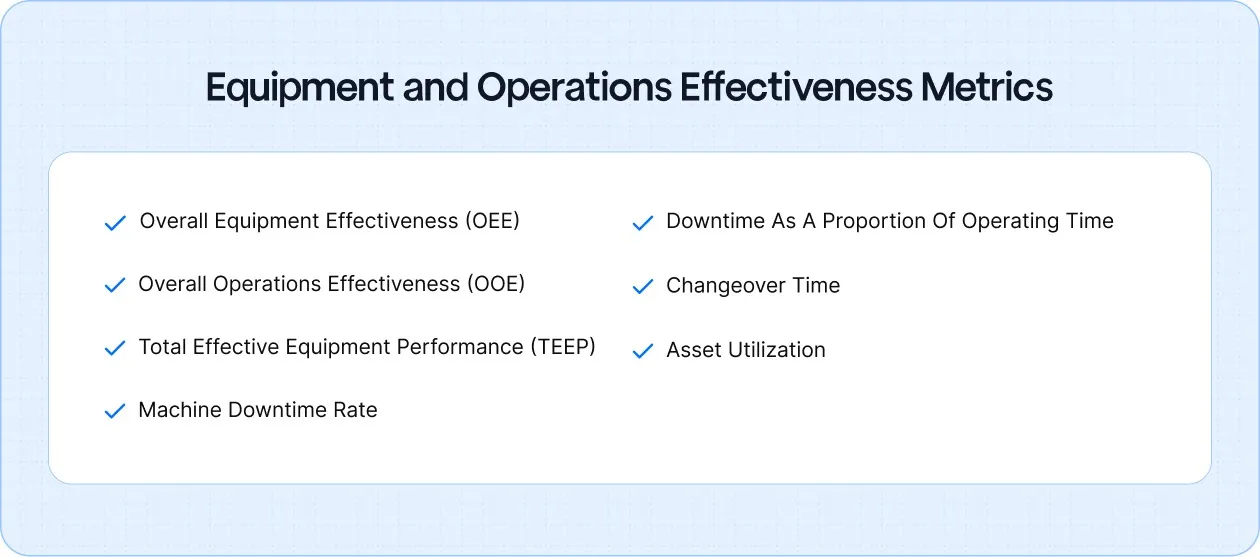
In manufacturing, buyers remember missed dates, inconsistent output, and production slowdowns far longer than they remember campaigns. These metrics exist to show whether the business can consistently do what marketing says it can.
- Overall Equipment Effectiveness (OEE)
OEE measures how effectively equipment produces saleable output when it is scheduled to run. It combines availability, performance, and quality into a single indicator of operational stability.
Formula: OEE = Availability × Performance × Quality Low
OEE increases downtime, slows throughput, and raises quality risk. When OEE is unstable, marketing claims around reliability, speed, or consistency become difficult to defend, even if demand exists.
- Overall Operations Effectiveness (OOE)
OOE extends OEE by factoring in planned downtime, offering a more realistic view of how operations perform across real-world conditions. This metric helps marketing teams understand true scalability. A plant may look efficient during scheduled runs, but frequent planned stoppages reduce the ability to absorb demand spikes without disruption.
- Total Effective Equipment Performance (TEEP)
TEEP measures how much output equipment generates relative to total available time, not just scheduled production hours. This makes it particularly useful for long-term growth planning. From a marketing perspective, TEEP reveals whether additional demand can be absorbed through better utilisation or whether capacity expansion is required before scaling campaigns.
- Machine Downtime Rate
This metric tracks how often and how severely equipment becomes unavailable. Downtime directly erodes delivery reliability and increases lead time variability. High downtime rates should immediately temper marketing promises around turnaround speed, flexibility, or just-in-time delivery.
- Downtime as a Proportion of Operating Time
Looking at downtime as a percentage of operating time helps quantify reliability risk. Even modest downtime percentages can have outsized effects in high-utilisation environments, where small disruptions cascade into missed commitments. Marketing should account for this when positioning uptime or consistency as differentiators.
- Changeover Time
Changeover time measures how long it takes to switch equipment from one job to another. Long changeovers reduce flexibility and make short runs, custom work, or mixed production schedules more expensive and slower. When changeover times are high, marketing should avoid promoting agility or rapid customisation without clear qualification.
- Asset Utilization
Asset utilization shows how effectively capital-intensive equipment is being used over time. Low utilisation may signal room for growth, while high utilisation suggests that marketing-led volume increases could strain reliability. Understanding this balance helps marketing align growth ambitions with operational reality.
Quality and Reliability Metrics That Shape Brand Trust
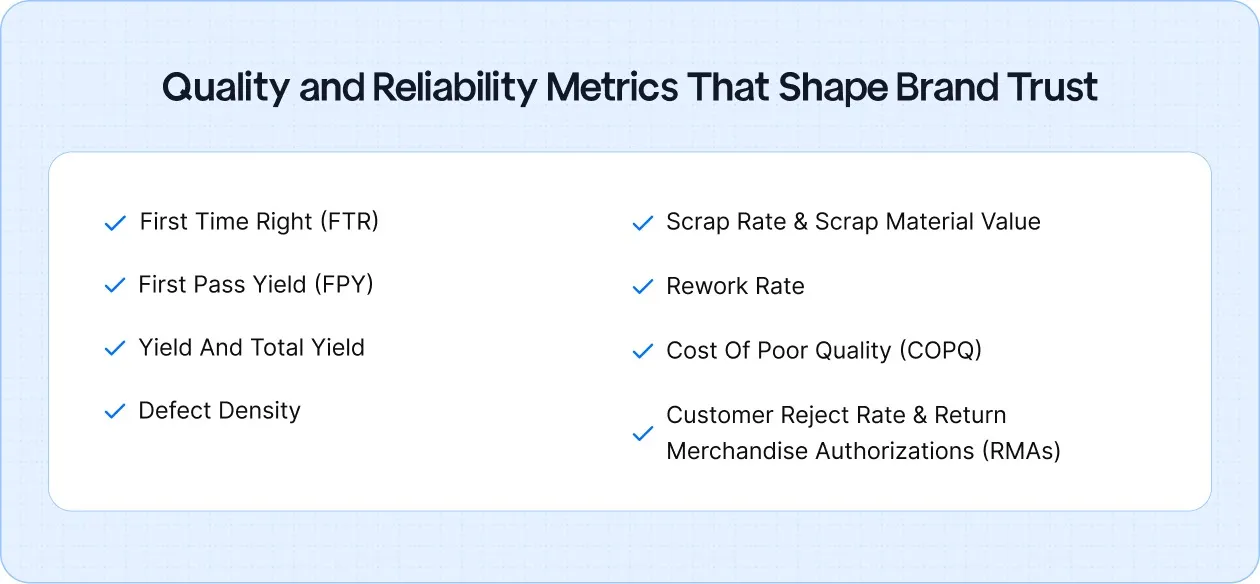
In manufacturing, brand trust is built on consistency. Buyers may be persuaded by capability on the first order, but they stay, refer, and pay premiums based on how reliably a supplier delivers to spec. Quality metrics are where marketing promises meet operational reality, and where trust is either reinforced quietly or lost very quickly.
- First Time Right (FTR)
FTR measures how often production meets specifications on the first attempt, without rework or correction. High FTR indicates process maturity and consistency, both of which support repeat orders and long-term customer confidence. When FTR is low, marketing-driven growth often amplifies hidden costs and delivery delays rather than revenue.
- First Pass Yield (FPY)
FPY tracks the percentage of units that pass through a process without defects or rework. Declining FPY increases cost leakage and extends lead times, even when output volume remains stable. From a marketing perspective, weak FPY undermines claims around efficiency and reliability.
- Yield and Total Yield
Yield compares good output to total output at specific stages, while total yield reflects cumulative performance across the full production process. Gaps between stage-level yield and total yield often point to systemic quality issues that surface downstream, where they are far more expensive to fix and harder to explain to customers.
- Defect Density
Defect density measures the number of defects per unit or per batch. Rising defect density signals declining process control. Even when defects are caught internally, persistent increases weaken marketing credibility because they tend to show up later as delays, pricing pressure, or customer dissatisfaction.
- Scrap Rate and Scrap Material Value
Scrap rate measures the proportion of materials discarded due to defects, while scrap material value quantifies the financial impact. High scrap erodes margins on marketing-driven growth and limits pricing flexibility, especially in cost-sensitive or competitive markets.
- Rework Rate
Rework rate captures how often products must be corrected before shipment. Rework inflates cost, slows throughput, and increases variability in delivery times. Marketing teams should be cautious about promoting speed or flexibility when rework rates are elevated.
- Cost of Poor Quality (COPQ)
COPQ aggregates the total financial impact of quality failures across the business.
Formula: COPQ = Internal Failure Costs + External Failure Costs
Internal failures include scrap and rework, while external failures include returns, warranty claims, and field fixes. COPQ directly connects quality performance to margin erosion and brand damage.
- Customer Reject Rate and Return Merchandise Authorizations (RMAs)
These metrics capture quality failures that reach the customer. Rising reject rates and RMAs are early indicators of churn risk and negative word-of-mouth, particularly damaging in industrial markets where trust and long-term relationships drive growth.
Delivery, Responsiveness, and Customer Experience Metrics
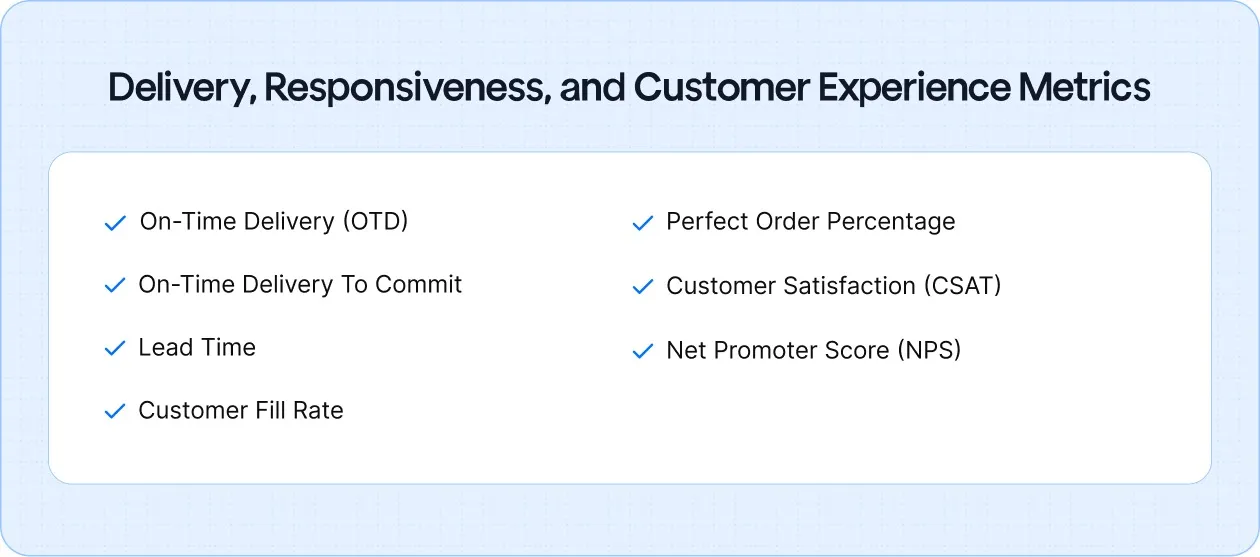
Customers rarely judge you by what you say. They judge you by what shows up at their dock, and when. A late shipment, a partial delivery, or a last-minute change often outweighs months of good communication.
These metrics capture that moment of truth. They show whether the expectations set by marketing and sales survive contact with reality, and whether customers come back because the experience matched what they were told to expect.
- On-Time Delivery (OTD)
OTD measures how often orders are delivered on or before the agreed date.
Formula: OTD (%) = (Orders Delivered On Time ÷ Total Orders) × 100
In B2B manufacturing, OTD is one of the strongest predictors of repeat orders. Consistent performance reinforces trust, while missed deliveries are remembered far longer than successful campaigns.
- On-Time Delivery to Commit
This metric goes a step further by measuring adherence to the specific dates promised to customers. High performance here indicates alignment between sales commitments, production planning, and marketing messaging. Poor performance often signals over-promising during demand generation.
- Lead Time
Lead time tracks the total duration from order placement to delivery. Longer lead times reduce competitiveness, especially in markets where buyers compare suppliers on responsiveness. Marketing should align positioning around speed or flexibility with actual lead time performance, not aspirational targets.
- Customer Fill Rate
Fill rate measures how completely customer orders are fulfilled from available stock or production capacity. Partial fulfilment erodes confidence and increases follow-up effort, even when deliveries are technically on time. High fill rates support marketing claims around reliability and readiness.
- Perfect Order Percentage
This metric captures orders delivered on time, in full, and without errors. Perfect order percentage is a direct measure of execution reliability and one of the clearest links between marketing promise and operational delivery.
- Customer Satisfaction (CSAT)
CSAT reflects immediate customer perception after delivery or service interaction. While influenced by many factors, sudden drops in CSAT often correlate with delivery or quality issues rather than marketing missteps.
- Net Promoter Score (NPS)
NPS measures long-term loyalty and willingness to recommend, making it more valuable for assessing sustainable growth than short-term campaign metrics. Strong NPS scores indicate that delivery and experience consistently support the brand story marketing tells.
Cost, Profitability, and Financial Impact Metrics
Revenue is easy to celebrate. Profit is harder to protect.
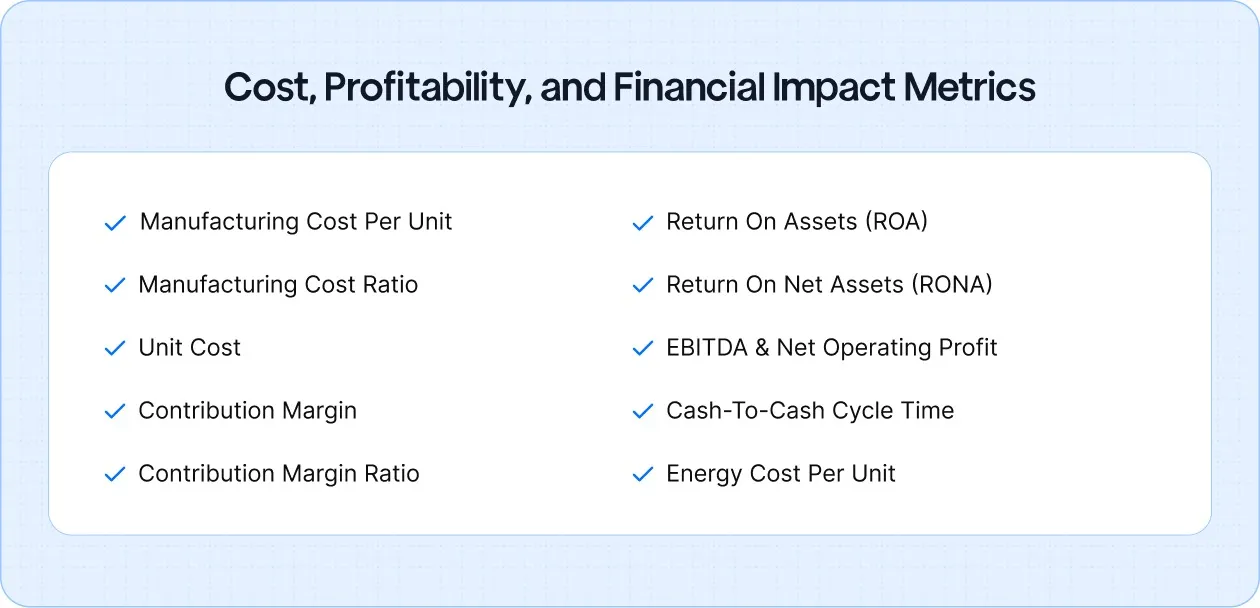
In manufacturing, growth that looks strong on the top line can quietly weaken the business if costs rise faster than pricing, or if new demand absorbs capacity without improving returns. These metrics exist to answer a simple but uncomfortable question: Is marketing bringing in work that actually strengthens the business?
- Manufacturing Cost per Unit (with and without materials)
This metric shows how much it truly costs to produce a single unit, separating material costs from labour, overhead, and energy where needed. For marketing, rising cost per unit reduces pricing flexibility and narrows the types of demand that remain profitable to pursue.
- Manufacturing Cost as a Percentage of Revenue
This ratio reveals how much of every revenue dollar is consumed by production. When this percentage climbs as revenue grows, it signals that marketing-driven growth may be eroding margins rather than strengthening them.
- Unit Cost
Unit cost represents the total cost required to manufacture one unit, including direct and indirect expenses. Accurate unit cost visibility is critical for pricing decisions, campaign profitability, and deciding which types of orders marketing should prioritise.
- Contribution Margin
Contribution margin measures how much revenue remains after covering variable costs.
Formula: Contribution Margin = Revenue − Variable Costs
This metric helps marketing teams understand whether new demand contributes meaningfully toward fixed costs and profit.
- Contribution Margin Ratio
Formula: Contribution Margin Ratio = Contribution Margin ÷ Revenue
This ratio allows comparisons across products, customers, or campaigns. Declining ratios often indicate that marketing is attracting price-sensitive or low-margin work.
- Return on Assets (ROA)
Formula: ROA = Net Income ÷ Total Assets
ROA shows how efficiently the business uses its assets to generate profit. Marketing growth that lowers ROA may increase revenue while weakening overall efficiency.
- Return on Net Assets (RONA)
Formula: RONA = Operating Profit ÷ Net Assets
RONA is particularly useful for capital-intensive manufacturers, highlighting whether growth improves returns on invested capital.
- EBITDA and Net Operating Profit
These metrics provide executive-level context for evaluating marketing’s financial contribution beyond campaign ROI. Sustained improvements here indicate that marketing activity is supporting healthier operations, not just pipeline growth.
- Cash-to-Cash Cycle Time
This metric measures how long cash is tied up from purchasing materials to receiving payment from customers. Shorter cycles improve liquidity and resilience, while longer cycles increase financial risk during growth phases.
- Energy Cost per Unit
Energy costs are increasingly significant in manufacturing cost structures. Rising energy cost per unit reduces pricing flexibility and can quickly erode margins on marketing-driven volume increases.
Maintenance, Compliance, and Risk Metrics
In manufacturing, stability is rarely visible when things are going well. It shows up when something goes wrong. Buyers, especially at the enterprise level, pay close attention to how suppliers manage risk, prevent disruption, and operate responsibly over time.
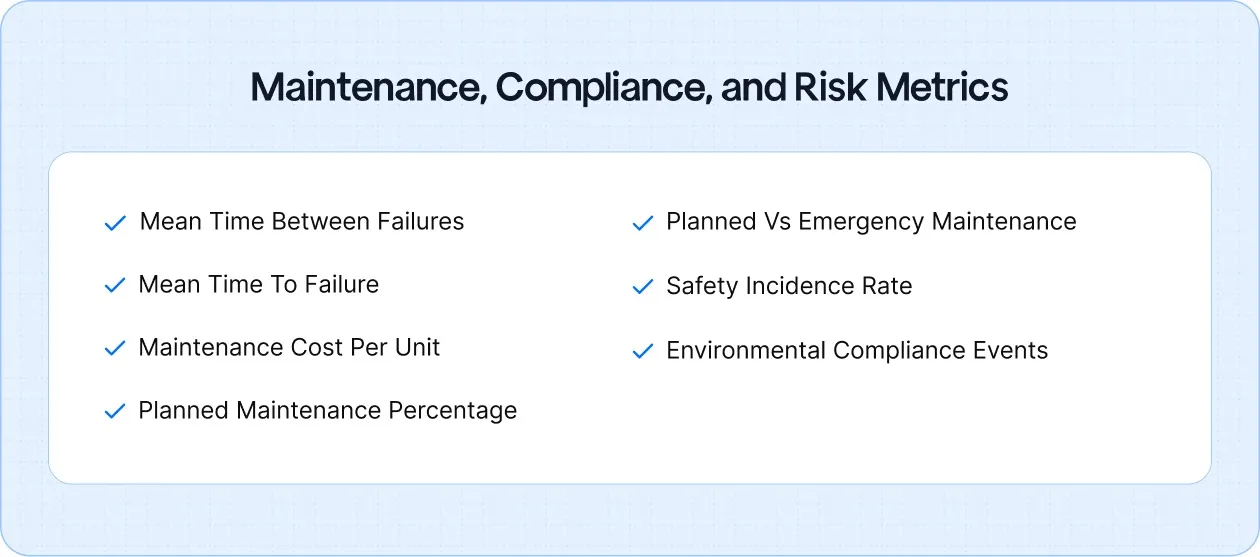
These metrics speak less to day-to-day output and more to how dependable the business is under pressure. For marketing teams, they matter because resilience, safety, and compliance increasingly influence supplier shortlists, contract renewals, and long-term partnerships.
- Mean Time Between Failure (MTBF)
MTBF measures the average operating time between equipment failures. Higher MTBF indicates stable, well-maintained operations and supports marketing claims around reliability and uptime. Declining MTBF often precedes delivery issues that customers notice long before internal dashboards do.
- Mean Time to Failure (MTTF)
MTTF estimates the expected operational lifespan of equipment before failure. Understanding MTTF helps set realistic expectations around equipment reliability and replacement planning, which indirectly affects service continuity and delivery commitments.
- Maintenance Cost per Unit
This metric tracks how much maintenance expense is incurred for each unit produced. Rising maintenance cost per unit often signals aging equipment or inefficient maintenance practices, both of which can undermine margin and delivery consistency as demand scales.
- Percentage Planned Maintenance (PMP)
PMP measures how much maintenance work is scheduled proactively rather than triggered by breakdowns.
Formula: PMP (%) = (Planned Maintenance Hours ÷ Total Maintenance Hours) × 100
Higher PMP reflects operational maturity. It reduces unexpected downtime and allows marketing teams to position reliability with greater confidence.
- Planned vs Emergency Maintenance Work Orders
The balance between planned and emergency work orders reveals whether the operation is in control or constantly reacting. A high share of emergency maintenance often leads to unpredictable delivery and weakened customer confidence.
- Health and Safety Incidence Rate
Safety performance is increasingly part of supplier evaluations, particularly for large manufacturers and regulated industries. Strong safety records signal disciplined operations, while poor performance can disqualify suppliers regardless of product quality or price.
- Environmental Incidents and Non-Compliance Events
Environmental performance now plays a direct role in procurement decisions and long-term contracts. Incidents or compliance failures can damage brand trust and limit eligibility for enterprise or sustainability-driven customers.
Workforce and Innovation Metrics That Influence Growth
These metrics sit at the intersection of capability and momentum. They reveal whether the organisation can absorb new demand without burning out teams or diluting quality.
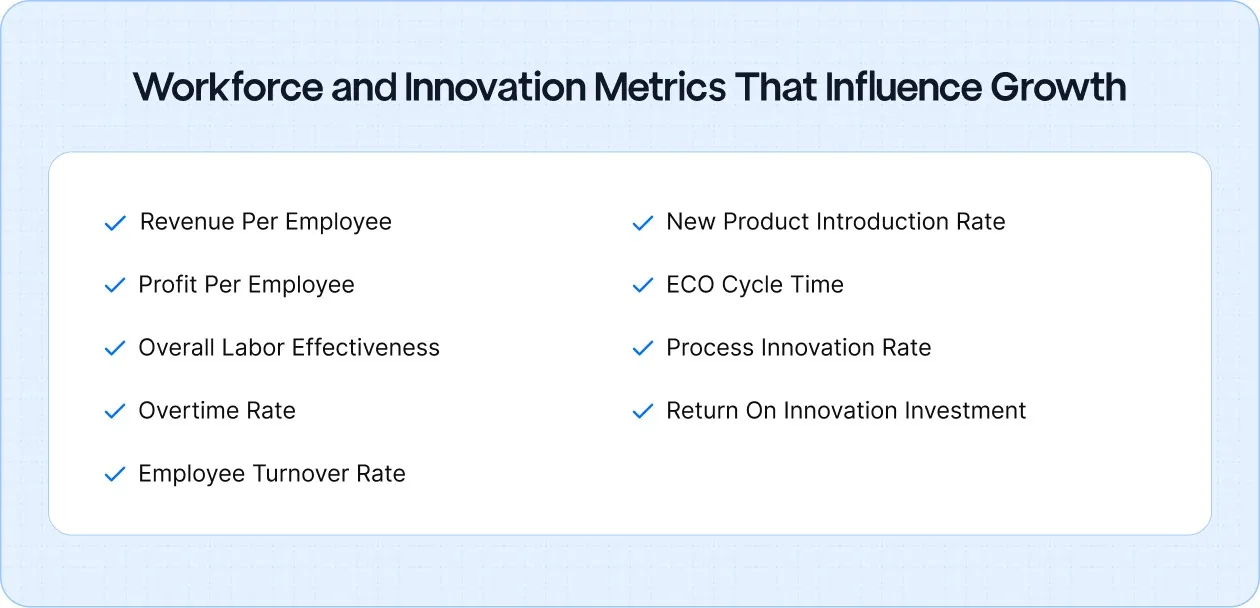
For marketing, this category matters because every promise eventually runs through people and processes. When workforce capacity and innovation discipline are weak, even well-targeted growth becomes fragile.
- Revenue per Employee
This metric measures how much revenue the business generates for each employee. Rising revenue per employee often indicates healthy productivity as demand scales. Sharp increases or declines, however, can signal imbalance, either through overextension or underutilisation of the workforce.
- Profit per Employee
Profit per employee adds margin context to productivity. It helps distinguish between growth driven by efficiency and growth driven by volume alone. Marketing-led demand that lowers this metric may be expanding activity without strengthening the business.
- Overall Labor Effectiveness (OLE)
OLE applies the logic of equipment effectiveness to labour performance, combining availability, performance, and quality. Low OLE suggests that labour constraints, skills gaps, or scheduling issues will limit how much demand the organisation can handle reliably.
- Overtime Rate
Overtime measures how often employees work beyond standard hours to meet demand. Short-term spikes can be manageable, but sustained high overtime signals capacity strain, increased error rates, and rising turnover risk, all of which undermine delivery and customer experience.
- Employee Turnover Rate
Turnover captures how frequently employees leave the organisation. High turnover disrupts process knowledge, weakens consistency, and erodes customer relationships, especially in specialised or technical manufacturing environments.
- Rate of New Product Introduction (NPI)
NPI measures how frequently new products or variants are successfully brought to market. A strong NPI rate supports marketing differentiation and relevance, while stagnation limits how effectively marketing can respond to changing customer needs.
- Engineering Change Order (ECO) Cycle Time
ECO cycle time tracks how quickly engineering changes move from request to implementation. Long cycle times reduce responsiveness to customer feedback and market shifts, making it harder for marketing to position flexibility or customisation credibly.
- Process Innovation Implementation Rate
This metric measures how quickly process improvements are adopted across operations. Slow implementation often signals organisational friction that constrains scalability and consistency.
- Return on Innovation Investment (ROII)
ROII evaluates whether spending on innovation translates into measurable business impact. It helps determine whether innovation efforts are creating real market advantage that marketing can confidently promote, or simply adding complexity without return.
Conclusion
Good marketing metrics do not exist to prove effort. They exist to create alignment.
For manufacturing companies, the most valuable metrics are the ones that connect demand to reality. They show when growth is sustainable, when it is risky, and when it is quietly eroding margins or trust. They help teams slow down when needed, push harder when the system can handle it, and focus on the kind of work that actually strengthens the business.
The goal is not to track everything. It is to track what changes decisions.
.webp)


.webp)


.svg)


